You can add Images, PDF documents or Charts to any sheet of your document
to present everyting with a great visual impact.
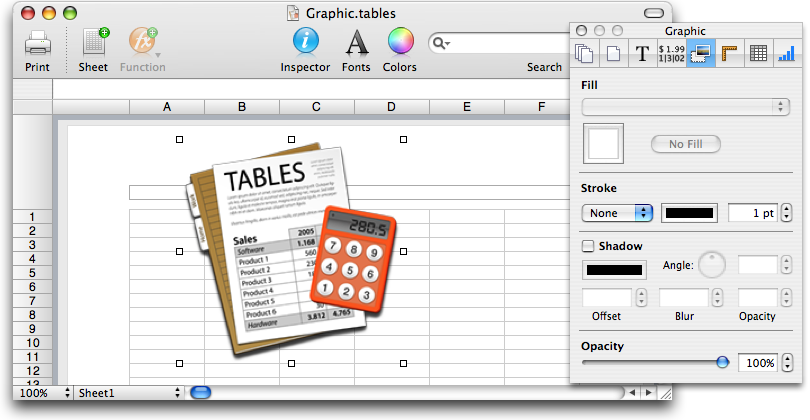
You can freely position the graphics on any page. Scale or flip the graphics to
your needs. Different borders and a shadow you can add to the graphics or you
can change the opacity so that underlying cells or other graphics shine through.
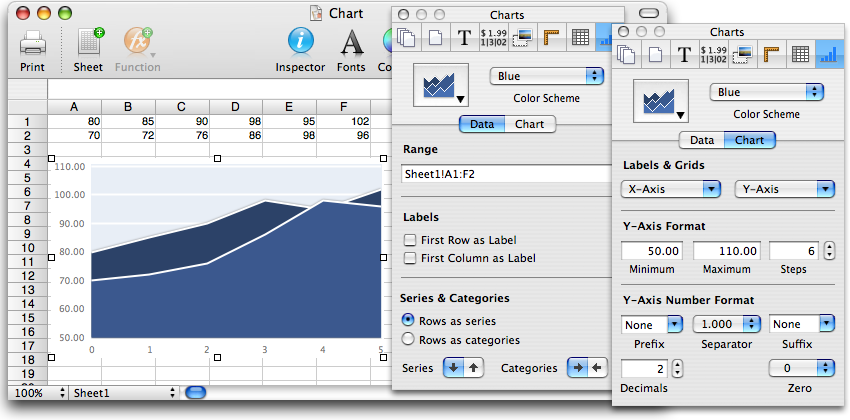
You can use charts of types: pie, line, (stacked) areas as well as (stacked)
columns for a graphical representation of your data.